In fact, I’m finding this variation makes even more sense then the original, this is the Layered burn-down chart, here is an example:
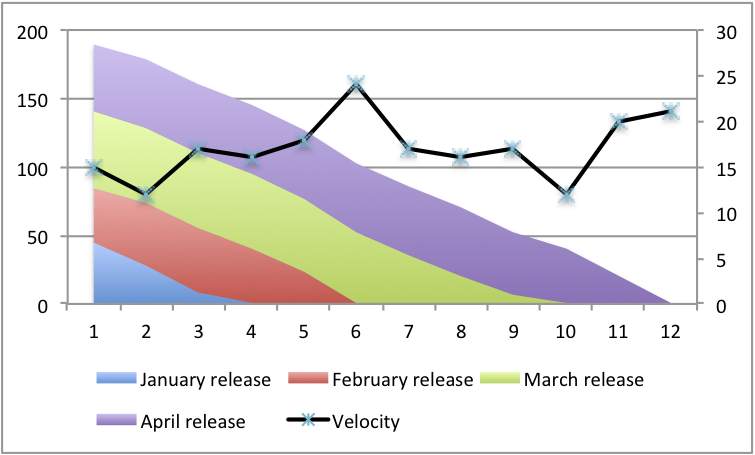
I’ve redrawn this example to remove client details. What it shows are three things:
- First the classic burn-down, just look at the overall line declining.
- Second the velocity line as described in my earlier blog
- Third the different colours layers show different releases, let me explain...
The contents of a release can - and would - change. But the company felt it knew what it wanted and since the team knew their velocity they could take a stab at which release it would be in. If something new was added the question was simply: when in which release do you want it? And the related stripe on the chart would increase.
That by the way is why the three strips of work yet to do are approximately equal size. If one grew it was obvious, work needed to be removed - either thrown away, or moved to another release, perhaps one that didn’t appear yet.
This was fairly straight forward when the company (thought) it knew everything to be done and ball-pack estimates could be given. With my SOA client they don’t know what the future holds but they can produce a striped chart for the work they do know about. In their case I’m suggesting every stripe represents a requested service rather than a release.
As new services are requested, and estimated, extra stripes can be added to show the total work required. Together with the velocity and slope it should be easy to see when a service will be available to their customers.
Nice !!! You can expect to see some layered burn downs when you next visit us.
ReplyDelete