(Whoops, I’m publishing a revision of this blog entry - something I don’t normally do. I realised after publication that I had mislabelled the graphs - they were correct but did not follow economists convention hence this revision. The core argument still stands although I have had to modify the reasoning slightly. Sorry.)
I’m proud to say I am, or at least was, a Software Engineer. I’m proud to say that I’m a third generation Engineer. My farther and grandfather got their hands dirty with the oily sort of engineering. But I’m also a frustrated Economist. Economics forms part of both of my degrees and on a couple of occasionsI’ve been temped to become a real Economist.
So I am always disappointed when someone talks about Software Economics. I have yet to find a serious study of software economics. Most of the studies, books and papers about “software economics” would be better called “software accounting.” They are about apportioning costs and adding up numbers. Economics is not Accountancy.
I have long believed software engineers and their managers would benefit from a better understanding of economics. In fact many of my clients will be used to hearing me refer to the supply side (development) and demand side (requirements, analysis, etc.).
I find it very useful to think of software development in supply and demand terms and use the tools of economists to understand what is happening. Usually thinking like this shows there supply and demand to be mismatched.
(This blog post that has been a long time coming. Several previous attempts have floundered because there is so much I want to say about software economics - and thinking in supply and demand terms. So while there might be little in this post which is earth shattering - especially to those of you who have studied economics - later posts will build on these ideas and analysis.)
Lets start with the fundamental problem which economic theory addresses: the allocation of scarce resources. After all we have scarce resources in software development so lets use an Economists tools: supply and demand.
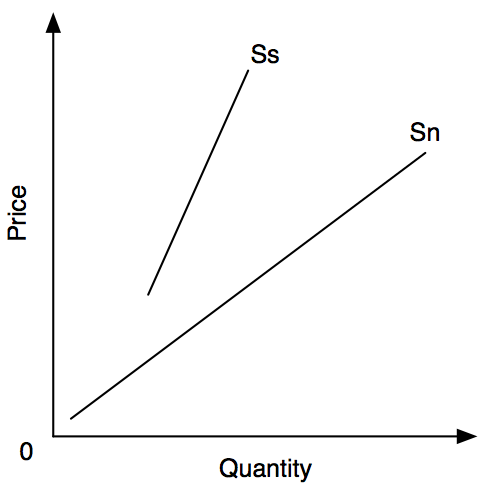
Lets have a look at the supply curve:

The line marked Sn is a normal supply curve. When price is a bit greater than zero individuals will start supplying their services and companies will come into being to supply the market. As the price increases more individuals and companies will be attracted to the market and supply will increase, more resources are brought to play.
Note two things here:
- Economists usually draw these curves for a product within a market. Here I am not examining the supply of multiple copies of a software product, rather I am examining the supply of software development capacity for a unique product. The marginal costs of supplying existing software are as close to zero as to be zero, the marginal costs of supplying new software products - i.e. the capacity to create a product - is significantly larger than zero and that is what we are examining here. In software terms we need to consider a software product, perhaps a single program, perhaps a “project” or a small system.
- If you are not an economist don’t worry about the fact that these “curves” are straight lines, the basic analysis still holds, we hold actual curves for an advanced class.
The software supply curve - Ss - starts the same way. When price is zero nobody supplies - perhaps not entirely true if we consider open source but close enough. As price increases more resources are brought into play and supply increases.
Software development is not cheap. If you are buying software developer services they are rarely cheap. The only time you get “cheap” software is when you buy (some) off the shelf stuff. Consequently when the price is low there is no supply of custom software.
But - and this is the BIG BUT - supply raises very slowly. Two people might write twice as much code as one but when they work together the generalised form of Brook’s Law comes into play: adding people to a software development effort slows a team down. Therefore supply responds slowly to price increases - what economists call inelastic.
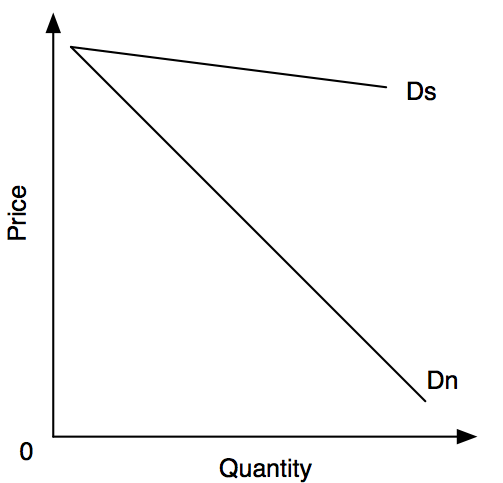
Now consider the demand for new software:

Here Dn represents demand for a normal product, when the price is high there is little demand for the product. As the price falls the demand increases because more people can afford it. (Remember an Economist’s definition of “Demand” is “A want with the ability to pay”. I may want a new iPad Air but if it is more than I can pay there is no demand - some might call this “latent demand.”)
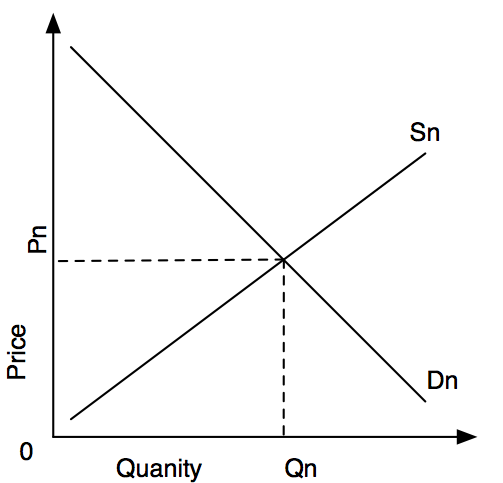
For normal products, in time, the market will “clear” and balance will be reached when the curves meet:

At some price (Pn) the quantity supplied (Qn) will match that demanded. Now economists accept that this might not happen instantly - and there are various models for that - but in the scheme of things the time it takes for the market to settle is not a big issue. It will happen eventually.
Until that happens all sorts of problems will ensue, some people might make a lot of profit, some people might go without and some people might have to pay a non-financial price, e.g. queues will form. All good stuff we could consider but lets leave that for another day.
Returning to the demand for software. People and companies do not want software for its own sake, they want software because of what it allows them to do. What Economists call a “derived demand”.
The problem is, and the reason I’ve drawn the the Ds curve as highly inelastic is that we are faced with an ever increasing demand for software. Processor power doubles every 18 months to two years (Moore’s Law) which means the things our computers are capable of doing - with the right software - is forever expanding. When we get this right the benefits can be massive. Which increases the demand for software…
- How many readers wanted to read newspapers on their telephone three years ago?
- How many readers knew they needed to watch TV on an iPad five years ago?
- How many readers took digital pictures with their telephone and posted them online on a social network to instantly share them with friends and relatives seven years ago?
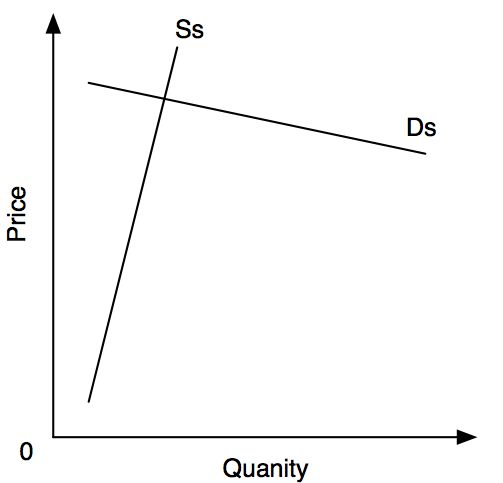
So lets look at the software supply and demand curves together:

For me, the problem in software economics:
- Demand is rampant but inelastic so as price rises it does not fall off very fast
- Supply is severely constrained and is very difficult to increase (particularly in the short run) so is also inelastic
- Consequently the market only clears at high prices and slowly: consequently markets take a long time to reach equilibrium, which in turn means we need to consider the tensions arising in a market which spends so much time out of equilibrium. Thus the time lags which normally only play a small part in classical economic analysis are more significant.
Each of these statements deserves further examination and explanation in their own right - future blogs, maybe.
More importantly, and also deserving of its own blog entry, is the question: what can be done to bring this market into equilibrium?
That is the question I find myself wrestling with on behalf of clients, and it is one I will return to.
Very interesting, I think I agree with it. I assume this is describing the situation for the software development market in general, or as a whole or something. There still seem to be I guess sub-markets where a different picture seems to be seen, markets where companies struggle to price software cheap enough to be attractive while still covering costs, or struggle to find customers. I think if more companies and developers understood more about the economical aspects of software development, we would be able to free up some of the capacity stuck in these low-value sub-markets, and redirect that capacity elsewhere which could help close the gap.
ReplyDeleteGreat article. Lots of research. Thanks for a most informative page.
ReplyDeleteA supply schedule is a table that shows the relationship between the price of a good and the quantity supplied. Under the assumption of perfect competition, supply is determined by marginal cost. Firms will produce additional output while the cost of producing an extra unit of output is less than the price they would receive. A demand schedule, depicted graphically as the demand curve, represents the amount of some good that buyers are willing and able to purchase at various prices, assuming all determinants of demand other than the price of the good in question, such as income, tastes and preferences, the price of substitute goods, and the price of complementary goods, remain the same. Following the law of demand, the demand curve is almost always represented as downward-sloping, meaning that as price decreases, consumers will buy more of the good If you wanna get more info go to http://www.dataproforbusiness.com/.
ReplyDeleteAllan seems like you did a thorough research about the topic and trust me you did an amazing work Thumbs Up! :)
ReplyDelete