In the last few weeks Michael Barritt of Oxford Innovation and myself have presented several versions of “Agile in Cornwall” - a case study of our work introducing Agile to companies in Cornwall.
All three versions of this Agile case study presentation are now on my website. I recommend the latest two version - Agile Business Conference and Agile Cambridge. The version from Agile on the Beach in Cornwall was supported with presentations from two of the companies concerned - Research Instruments and Sullivan Cuff Software. In fact, you can find my own case study of the work at Sullivan Cuff on the Software Strategy website. A video version of this will be available in the near future.
If this interest you, or you want to hear it not read it, then I’ll be doing a revised version of the presentation at Skills Matter in a couple of weeks - “Agile Cornwall case study: How the EU is helping Cornish companies get Agile” - a free event, registration required.
Sunday, October 16, 2011


Monday, October 10, 2011
Layered burn-down charts
I’d like to conclude this Burn-down chart mini-series (Burn-downs are not just for Sprints and Advice for creating burn-down) by showing a variation on the classical burn-down chart I created with one of my Cornish clients. I’ve recently been advising an SOA project at another client to adopt a similar approach.
In fact, I’m finding this variation makes even more sense then the original, this is the Layered burn-down chart, here is an example:
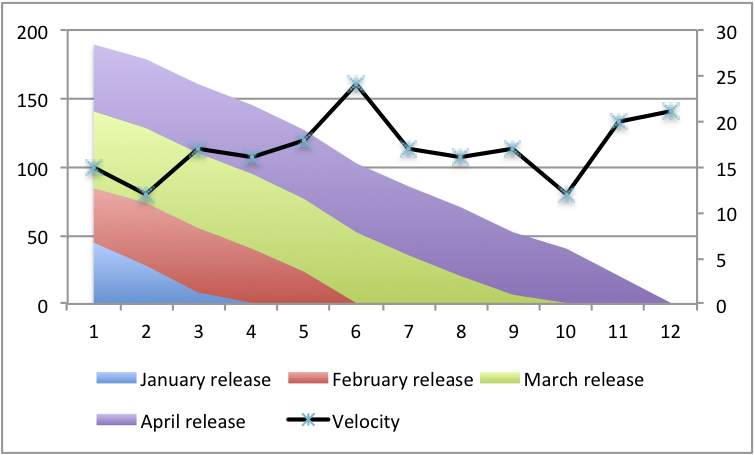
I’ve redrawn this example to remove client details. What it shows are three things:
The contents of a release can - and would - change. But the company felt it knew what it wanted and since the team knew their velocity they could take a stab at which release it would be in. If something new was added the question was simply: when in which release do you want it? And the related stripe on the chart would increase.
That by the way is why the three strips of work yet to do are approximately equal size. If one grew it was obvious, work needed to be removed - either thrown away, or moved to another release, perhaps one that didn’t appear yet.
This was fairly straight forward when the company (thought) it knew everything to be done and ball-pack estimates could be given. With my SOA client they don’t know what the future holds but they can produce a striped chart for the work they do know about. In their case I’m suggesting every stripe represents a requested service rather than a release.
As new services are requested, and estimated, extra stripes can be added to show the total work required. Together with the velocity and slope it should be easy to see when a service will be available to their customers.
In fact, I’m finding this variation makes even more sense then the original, this is the Layered burn-down chart, here is an example:
I’ve redrawn this example to remove client details. What it shows are three things:
- First the classic burn-down, just look at the overall line declining.
- Second the velocity line as described in my earlier blog
- Third the different colours layers show different releases, let me explain...
The contents of a release can - and would - change. But the company felt it knew what it wanted and since the team knew their velocity they could take a stab at which release it would be in. If something new was added the question was simply: when in which release do you want it? And the related stripe on the chart would increase.
That by the way is why the three strips of work yet to do are approximately equal size. If one grew it was obvious, work needed to be removed - either thrown away, or moved to another release, perhaps one that didn’t appear yet.
This was fairly straight forward when the company (thought) it knew everything to be done and ball-pack estimates could be given. With my SOA client they don’t know what the future holds but they can produce a striped chart for the work they do know about. In their case I’m suggesting every stripe represents a requested service rather than a release.
As new services are requested, and estimated, extra stripes can be added to show the total work required. Together with the velocity and slope it should be easy to see when a service will be available to their customers.
Thursday, October 06, 2011
Advice for creating burn-down - and other capacity measurements
Continuing from my last blog entry (Burn-downs are not just for Sprints) I’d like to offer some advice on the subject, burn-downs, cumulative flow diagrams, velocity, etc..
1) Don’t track hours. Hours are input and its better to measure outputs. Hours are subjective, see my Humans can't estimate tasks blog. Worse still we have too many psychological hang-ups about hours to make them usable. Instead you want your own currency, call them story points, abstract points, nebulous units of time or what ever you like. Having your own currency allows it to adjust to your team.
Each team has its own currency. Its like having the dollar, euro and pound. They all float independently, there is an exchange rate but it changes.
2) Draw your graphs by hand, process your data by hand. Get a feel for your data. Unless you have a feel for the data and an understanding of how it comes to be you can’t reason about it.
When I say “by hand” I allow you to use Excel (or similar), graph paper is better, but whatever you use don’t use a tool like Rally, Version One, etc. because you won’t have a feel.
Jack Kilby, co-inventor of the silicon chip and pioneer of the electronic calculator, lamented that his invention(s) deskilled engineers. Before the calculator engineers used a slide rule, this meant the engineers needed to know where to put the decimal point. They needed a feel for the data. Kilby lamented that the calculator meant engineers didn’t have the same intuition because of the calculator and led them to make mistakes elsewhere.
4) Use estimated data, forget actuals: estimates and actuals are apples and oranges, or rather, they are future facing estimates and retrospectives estimates.
Estimate tasks just before you do them (e.g. iteration planning meeting), put ball-park estimate on stories which you aren’t going to do any time soon (i.e. later than this iteration), and use averages for really long term stuff.
When you break the stories into tasks, or epics into stories, don’t expect the numbers to match. In fact, you might want to track the variation for longer range forecasting.
5) From 2 & 4: if you have a time-tracking/time-sheeting system leave it to one side, let it exist in its own little fantasy bubble. Don’t use the data, its toxic - see my entries on Capers Jones work. Live by your velocity measurements and charts.
Ultimately, burn-downs are about capacity measurement: John Seddon in Freedom from Command & Control talks about creating capacity measurement charts within organisations. The various graphs we use in Agile are our version of capacity measurement. Accepting its about capacity measurement means its not about targeting. Targeting is wrong see my entry form last year - Velocity targeting and velocity inflation - for more about this.
1) Don’t track hours. Hours are input and its better to measure outputs. Hours are subjective, see my Humans can't estimate tasks blog. Worse still we have too many psychological hang-ups about hours to make them usable. Instead you want your own currency, call them story points, abstract points, nebulous units of time or what ever you like. Having your own currency allows it to adjust to your team.
Each team has its own currency. Its like having the dollar, euro and pound. They all float independently, there is an exchange rate but it changes.
2) Draw your graphs by hand, process your data by hand. Get a feel for your data. Unless you have a feel for the data and an understanding of how it comes to be you can’t reason about it.
When I say “by hand” I allow you to use Excel (or similar), graph paper is better, but whatever you use don’t use a tool like Rally, Version One, etc. because you won’t have a feel.
Jack Kilby, co-inventor of the silicon chip and pioneer of the electronic calculator, lamented that his invention(s) deskilled engineers. Before the calculator engineers used a slide rule, this meant the engineers needed to know where to put the decimal point. They needed a feel for the data. Kilby lamented that the calculator meant engineers didn’t have the same intuition because of the calculator and led them to make mistakes elsewhere.
4) Use estimated data, forget actuals: estimates and actuals are apples and oranges, or rather, they are future facing estimates and retrospectives estimates.
Estimate tasks just before you do them (e.g. iteration planning meeting), put ball-park estimate on stories which you aren’t going to do any time soon (i.e. later than this iteration), and use averages for really long term stuff.
When you break the stories into tasks, or epics into stories, don’t expect the numbers to match. In fact, you might want to track the variation for longer range forecasting.
5) From 2 & 4: if you have a time-tracking/time-sheeting system leave it to one side, let it exist in its own little fantasy bubble. Don’t use the data, its toxic - see my entries on Capers Jones work. Live by your velocity measurements and charts.
Ultimately, burn-downs are about capacity measurement: John Seddon in Freedom from Command & Control talks about creating capacity measurement charts within organisations. The various graphs we use in Agile are our version of capacity measurement. Accepting its about capacity measurement means its not about targeting. Targeting is wrong see my entry form last year - Velocity targeting and velocity inflation - for more about this.
Tuesday, October 04, 2011
Burn-downs are not just for Sprints
One of the key tools in Agile is: make things visible. When you can see the thing you can share the thinking and reason able it.
Capacity charts - usually burn-down, burn-up or their cousins Cumulative Flow Diagrams - are amazingly useful things. They show you the state of a development effort. They show this in data. Data by itself is hard to reason with but put it in a graph and wonderful things happen.
It has recently come to my attention that what I thought was obvious about these charts isn’t. So this blog entry, and maybe a few more to come, I plan to discuss charts, and specifically burn-downs, in a bit more depth,
I always encourage, sometime coerce, teams into produce some graphical tracking of their work. For someone like me who’s favourite tool is an spreadsheet this is a piece of cake. But have to remind myself that not everyone finds this so easy.
Importantly there are two burn-down charts you might want to create: a Sprint burn-down and A Product Burn-down. It should be immediately obvious that these correspond to the Sprint Backlog and the Product Backlog.
Just to be clear:

Now I’ve never found sprint based burn-down charts very helpful. Perhaps because my background is working on large development efforts which take months or even years to deliver I rarely see an actual delivery at the end of a sprint. We may have something to show but its only a step on the way to something bigger.
Or perhaps its the economist or statistician in me, trained never to read too much into one set of data figures, and I know we can all have bad days, so I don’t see the point of acting when yesterdays velocity falls.
But I know some people do find value in sprint burn-down so I don’t object if you want one.
However, I always see Product Burn-down charts as vital.
Except on the smallest pieces of work there will be something coming next and a product burn-down can give a good sense of context, overall progress and, most importantly, when you could be finished - especially important on large pieces of work. Armed with this information you can construct sensible release plans.
I recently came across two teams at different companies who had burn-down charts but the charts only covered the iteration (sprint). This seemed wrong to me, it doesn’t tell me much. On closer examination the explanation become clear: the product backlog for both teams wasn’t in a state you could use for a burn-down.
Now if you are taking a truly evolutionary approach this isn’t a problem, you re-evaluate iteration-to-iteration. But actually, few teams take a completely evolutionary approach and these two teams where far closer to the iterative style (i.e. they had original requirements documents to work from).
The lack of a longer-term burn-down was a problem and a sign of a bigger problem.
One enhancement I like to make is adding velocity to the burn down chart. Take this one for example:

This adds a second axis (in Excel you have to hunt around for this option) which allows you to see the team velocity sprint-on-sprint.
The key thing is, without this data, velocity and burn-down - and the graphs to understand it - each sprint exists in isolation. That might be OK if you are delivering every sprint and you don’t need to peek into the future. But the kind of work I see does need to look forward and this information is essential.
Finally, I’ve most of what I’ve said about burn-downs applies equally well to cumulative-flow-diagrams (CFDs). In fact I prefer CfDs and readily use them over burn-downs because they help show how work increases. However, I have also discovered that CFDs are not only harder to construct and update but also harder to explain to people. There is something obvious about burn-downs.
Anyway, you pays your money, you takes your choice. Its up to you.
Capacity charts - usually burn-down, burn-up or their cousins Cumulative Flow Diagrams - are amazingly useful things. They show you the state of a development effort. They show this in data. Data by itself is hard to reason with but put it in a graph and wonderful things happen.
It has recently come to my attention that what I thought was obvious about these charts isn’t. So this blog entry, and maybe a few more to come, I plan to discuss charts, and specifically burn-downs, in a bit more depth,
I always encourage, sometime coerce, teams into produce some graphical tracking of their work. For someone like me who’s favourite tool is an spreadsheet this is a piece of cake. But have to remind myself that not everyone finds this so easy.
Importantly there are two burn-down charts you might want to create: a Sprint burn-down and A Product Burn-down. It should be immediately obvious that these correspond to the Sprint Backlog and the Product Backlog.
Just to be clear:
- Sprint based burn-down chart which shows the progress in the current sprint towards completion of all scheduled work and shows work on a day-to-day basis.
- Product based burn-down chart which shows progress through some larger quantity of work, e.g. project, release, milestone. These are updated on a sprint to sprint basis.
Now I’ve never found sprint based burn-down charts very helpful. Perhaps because my background is working on large development efforts which take months or even years to deliver I rarely see an actual delivery at the end of a sprint. We may have something to show but its only a step on the way to something bigger.
Or perhaps its the economist or statistician in me, trained never to read too much into one set of data figures, and I know we can all have bad days, so I don’t see the point of acting when yesterdays velocity falls.
But I know some people do find value in sprint burn-down so I don’t object if you want one.
However, I always see Product Burn-down charts as vital.
Except on the smallest pieces of work there will be something coming next and a product burn-down can give a good sense of context, overall progress and, most importantly, when you could be finished - especially important on large pieces of work. Armed with this information you can construct sensible release plans.
I recently came across two teams at different companies who had burn-down charts but the charts only covered the iteration (sprint). This seemed wrong to me, it doesn’t tell me much. On closer examination the explanation become clear: the product backlog for both teams wasn’t in a state you could use for a burn-down.
Now if you are taking a truly evolutionary approach this isn’t a problem, you re-evaluate iteration-to-iteration. But actually, few teams take a completely evolutionary approach and these two teams where far closer to the iterative style (i.e. they had original requirements documents to work from).
The lack of a longer-term burn-down was a problem and a sign of a bigger problem.
One enhancement I like to make is adding velocity to the burn down chart. Take this one for example:
This adds a second axis (in Excel you have to hunt around for this option) which allows you to see the team velocity sprint-on-sprint.
The key thing is, without this data, velocity and burn-down - and the graphs to understand it - each sprint exists in isolation. That might be OK if you are delivering every sprint and you don’t need to peek into the future. But the kind of work I see does need to look forward and this information is essential.
Finally, I’ve most of what I’ve said about burn-downs applies equally well to cumulative-flow-diagrams (CFDs). In fact I prefer CfDs and readily use them over burn-downs because they help show how work increases. However, I have also discovered that CFDs are not only harder to construct and update but also harder to explain to people. There is something obvious about burn-downs.
Anyway, you pays your money, you takes your choice. Its up to you.
Thursday, September 29, 2011
Agile Cambridge: Cornwall Case Study online
The slides from my presentation at Agile Cambridge are now on my website: Agile County, Making Cornwall Agile (a case study)
Wednesday, September 28, 2011
Propogation delays
Propagation delays occur when there is a chain reaction, a sequence of reactions which take time to work down the chain. Think of a line of traffic waiting at the red light. The light turns green: the driver of the first car doesn’t move instantaneously, it takes a moment to registers the change, perhaps move the car into gear or take the hand break off, moment to press the accelerator and a moment for the engine to start moving the car.
The second car in the line might be watching the traffic light but they are also watching the car in front. Only when the break lights (if on) go off and the car begins to move can they move. And so on.
It takes time for the change to work its way down the line.
The same thing happens in integrated circuits, silicon chips. Even electrons take time to move. Reducing propagation delays is one of the ways chips get to go faster.
Once you know about propagation delays you start seeing them everywhere. Increasingly I not only see them in software development teams but I talk about them. But not everyone knows the concept, hence this blog.
Propagation delays occur when one team, or one developer, changes some code, or perhaps a database schema, and it takes time for all the other team members to update their code base and make any resulting changes.
Propagation delays occur when a company decides to start doing something, or stop doing something, and it takes time to work down the chain and to actually stop or start.
Propagation delays cause tension because different people, or teams, are working to different assumptions.
As with chips and traffic reducing propagation delays can speed things up.
The second car in the line might be watching the traffic light but they are also watching the car in front. Only when the break lights (if on) go off and the car begins to move can they move. And so on.
It takes time for the change to work its way down the line.
The same thing happens in integrated circuits, silicon chips. Even electrons take time to move. Reducing propagation delays is one of the ways chips get to go faster.
Once you know about propagation delays you start seeing them everywhere. Increasingly I not only see them in software development teams but I talk about them. But not everyone knows the concept, hence this blog.
Propagation delays occur when one team, or one developer, changes some code, or perhaps a database schema, and it takes time for all the other team members to update their code base and make any resulting changes.
Propagation delays occur when a company decides to start doing something, or stop doing something, and it takes time to work down the chain and to actually stop or start.
Propagation delays cause tension because different people, or teams, are working to different assumptions.
As with chips and traffic reducing propagation delays can speed things up.
Friday, September 23, 2011
Updates for Dialogue Sheets
Two dialogue sheet updates today.
Firstly I’ve created a mailing list to make announcements about dialogue sheets and for discussions about the use of dialogue sheets. This list is open to all and is hosted on Google groups (so you need a Google account).
Second, I’ve uploaded a new dialogue sheet. Another retrospective sheet this one is designed for use at the end of training course. I’ve used it at the end of several Software Strategy Agile training course and it has been well received. This sheet fulfils three purposes:
As usual, all this is at www.dialoguesheets.com.
Firstly I’ve created a mailing list to make announcements about dialogue sheets and for discussions about the use of dialogue sheets. This list is open to all and is hosted on Google groups (so you need a Google account).
Second, I’ve uploaded a new dialogue sheet. Another retrospective sheet this one is designed for use at the end of training course. I’ve used it at the end of several Software Strategy Agile training course and it has been well received. This sheet fulfils three purposes:
- It allows participants to experience a retrospective
- It provides for a retrospective on a training course at the end of the course
- It introduces dialogue sheets as a technique for retrospectives
As usual, all this is at www.dialoguesheets.com.
Cover for Business Patterns for Software
My new book, Business Patterns for Software Developers, now has a cover. Here it is:

The Business Patterns is available for pre-order, it will be published until early in the new year, I’m guessing February but it could move either way.
The Business Patterns is available for pre-order, it will be published until early in the new year, I’m guessing February but it could move either way.
Tuesday, September 20, 2011
Dialogue Sheets in Methods & Tools
The latest issue of Methods and Tool (Fall 2011) contains an article about Retrospective Dialogue Sheets. If you are new to Dialogue Sheets it will make a good introduction, and if you’ve used them already thenI’d love to hear your feedback.
Thursday, September 15, 2011
Dear client, the truth about software development
Dear Customer,
I think its time we in the IT industry came clean about how we charge you and why our bills are sometimes a bit higher than you might expect.
The truth is, when we start and IT project we just don’t know how much time and effort it will take. Consequently we don’t know how much it will cost. This isn’t a message you like to hear, particularly since you can be absolutely certain that you know what you want.
Here in lies another truth, I’ll try and put it as politely as I can, you are, after all, a customer and really I shouldn’t offend you. The thing is, you don’t know what you want. O yerh, you know in general (usually) but the devil is in the detail. And the more you try and give us the detail before hand the more likely it is to change. Each time you give us more detail you are offering more hostages to fortune.
Just to complicate matters the world in uncertain. Things change, companies go out of business, customer tastes change, fashion changes, Governments change and competitors do their damnedest to make life hard.
Yes it is true we can sometimes gold plate things. Yes some of our engineers like to do more than needed, and yes we have vested interest in getting things added so we can charge you more.
It is also true that you have add things: you quite legitimately think of things after we’ve begun, you quite naturally assume something is “in” when we assumed it was “out” and you also try and put one over too.
(Lets not even talk about bugs right now, it just complicates everything.)
Frankly, given all of this it is touching that you have so much faith in IT to deliver. But then, when IT does deliver, boy, does it deliver big. Look what it did for Bill Gates and Larry Page, or Jeff Bezos of Amazon, or FedEx, the list goes on.
So how do we ever talk you into this?
Well, we package up this unsightly mess and try and sell it to you. To do this we have to hide all this unpleasantness. We estimate how much time we think the work will take, actually these “estimates” are little better than guesses; human’s can’t estimate, most companies don’t have historical data and for those that do have data most of it is worse than useless.
So we get this guess, sorry estimate, and double it. Well maybe we double it, we might treble it, and when we see the new number, if it looks too much we might reduce it. And then we work out whether you will pay it.
That might sound awful but remember: we could have guessed higher in the first place.
Anyway, we don’t know which number is “right” but to make it acceptable to you we pretend it is certain and we take on the risk. We can only do this if the number is sufficiently padded. And even then we go wrong.
If the risk doesn’t happen then we get a fat profit, if the risk comes to pass we don’t get any profit, maybe we make a loss, and if its really bad you don’t get anything and we end up in court.
Really its all a question of risk: we try to present a clean, low-risk solution to your problem, and in doing so we take on a lot of risk. The alternative is that you take on the risk - and the mess - and do it yourself. (Unfortunately, another sad truth, is that as far as anyone can tell in-house IT is generally not as good as specialist providers so if you do decide to take on the risk you actually increase it.)
There really isn’t a nice simple solution to this, you have to work with us on this.
Thats the first part of the solution: you, the customer, have to be prepared to work with us, the supplier, and work with us again and again. This will reduce the risk.
The second part of the solution is: you need to be prepared to accept the mess and share the risk with us. If you aren’t prepared to take on any risk then we will take it on, and we will charge you for it, and since the risk is a lot we will charge you a lot.
Sharing the risk also has the effect of reducing the risk. Once you share the risk you have a motivation to reduce it.
If you are prepared to accept those two suggestions then lets press reset on our relationship and talk some more.
I think its time we in the IT industry came clean about how we charge you and why our bills are sometimes a bit higher than you might expect.
The truth is, when we start and IT project we just don’t know how much time and effort it will take. Consequently we don’t know how much it will cost. This isn’t a message you like to hear, particularly since you can be absolutely certain that you know what you want.
Here in lies another truth, I’ll try and put it as politely as I can, you are, after all, a customer and really I shouldn’t offend you. The thing is, you don’t know what you want. O yerh, you know in general (usually) but the devil is in the detail. And the more you try and give us the detail before hand the more likely it is to change. Each time you give us more detail you are offering more hostages to fortune.
Just to complicate matters the world in uncertain. Things change, companies go out of business, customer tastes change, fashion changes, Governments change and competitors do their damnedest to make life hard.
Yes it is true we can sometimes gold plate things. Yes some of our engineers like to do more than needed, and yes we have vested interest in getting things added so we can charge you more.
It is also true that you have add things: you quite legitimately think of things after we’ve begun, you quite naturally assume something is “in” when we assumed it was “out” and you also try and put one over too.
(Lets not even talk about bugs right now, it just complicates everything.)
Frankly, given all of this it is touching that you have so much faith in IT to deliver. But then, when IT does deliver, boy, does it deliver big. Look what it did for Bill Gates and Larry Page, or Jeff Bezos of Amazon, or FedEx, the list goes on.
So how do we ever talk you into this?
Well, we package up this unsightly mess and try and sell it to you. To do this we have to hide all this unpleasantness. We estimate how much time we think the work will take, actually these “estimates” are little better than guesses; human’s can’t estimate, most companies don’t have historical data and for those that do have data most of it is worse than useless.
So we get this guess, sorry estimate, and double it. Well maybe we double it, we might treble it, and when we see the new number, if it looks too much we might reduce it. And then we work out whether you will pay it.
That might sound awful but remember: we could have guessed higher in the first place.
Anyway, we don’t know which number is “right” but to make it acceptable to you we pretend it is certain and we take on the risk. We can only do this if the number is sufficiently padded. And even then we go wrong.
If the risk doesn’t happen then we get a fat profit, if the risk comes to pass we don’t get any profit, maybe we make a loss, and if its really bad you don’t get anything and we end up in court.
Really its all a question of risk: we try to present a clean, low-risk solution to your problem, and in doing so we take on a lot of risk. The alternative is that you take on the risk - and the mess - and do it yourself. (Unfortunately, another sad truth, is that as far as anyone can tell in-house IT is generally not as good as specialist providers so if you do decide to take on the risk you actually increase it.)
There really isn’t a nice simple solution to this, you have to work with us on this.
Thats the first part of the solution: you, the customer, have to be prepared to work with us, the supplier, and work with us again and again. This will reduce the risk.
The second part of the solution is: you need to be prepared to accept the mess and share the risk with us. If you aren’t prepared to take on any risk then we will take it on, and we will charge you for it, and since the risk is a lot we will charge you a lot.
Sharing the risk also has the effect of reducing the risk. Once you share the risk you have a motivation to reduce it.
If you are prepared to accept those two suggestions then lets press reset on our relationship and talk some more.
Subscribe to:
Posts (Atom)